AI forecasting & anomaly detection
Models that anticipate demand and flag the gap before it costs, where statistical forecasting no longer catches the weak signals.
Forecasting by looking at history is no longer enough.
Statistical forecasting in a spreadsheet reacts poorly to weak signals and to breaks. It describes a seasonality, not a market that moves, and it does not see the anomaly until it has become a gap.
An AI forecast learns from history but feeds on real-time signals, and anomaly detection runs on the flows rather than on extracts. The gap surfaces while it can still be corrected.
What we do
Four capabilities to move decisions from after the fact to during.
AI forecasting
Models trained on history and fed by real-time signals: demand, attendance, stock, load. Seasonality is no longer the only factor taken into account.
Anomaly detection
Volume, distribution and latency of each flow are compared with their own history. A reading outside the expected band surfaces before reaching a dashboard or a model.
Scenarios and trade-offs
The forecast comes as quantified scenarios rather than a single value, so the decision is made on a range rather than on a point.
Retraining loop
Drift is measured against the reference dataset, and crossing the threshold triggers retraining rather than an alert somebody has to read.
What you get
A model in a real environment
A first model in service on a chosen scope, with its baseline measured before go-live.
Detection wired into the flows
Anomaly checks in production, expected bands calibrated and alerts connected to an action.
Drift monitoring
The monitoring view for forecast quality, cost per prediction and retraining triggers.
What it changes in your business
Forecasting does not mean the same thing depending on what you steer. Pick your sector: the description says what we forecast and what we watch, the run on the right shows the shape of what is handed over.
Balancing a grid that plays out minute by minute
Intermittent renewables and unpredictable demand peaks turn balancing into a permanent trade-off. Multi-horizon forecasting, from five minutes to twenty-four hours, moves network operators from curative to anticipative, and anomaly detection on meter readings flags a drifting substation before the on-call team finds it.
- Supply / demand forecasting from 5 minutes to 24 hours
- Weather and meter readings fed into the model
- Maintenance triggered by drift, not by the calendar
Anticipate rather than record
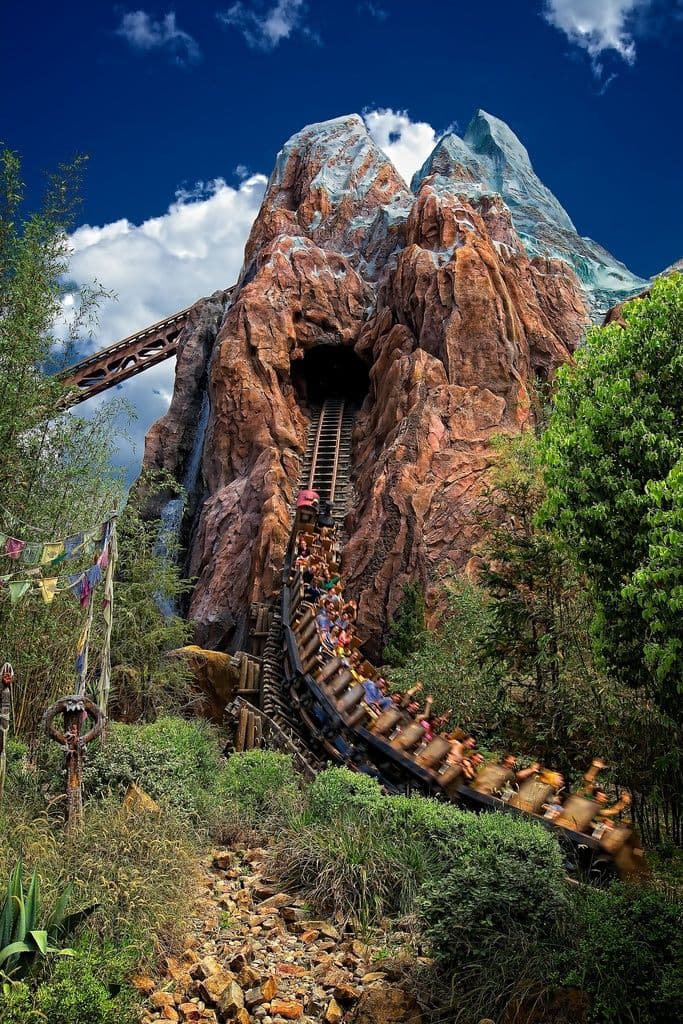
Attendance forecast by AI, waiting time cut by more than half
+16% revenue · −58% attraction wait
Anticipate attendance peaks to cut waiting times and optimise revenue, from massive datasets and real-time signals that statistical forecasting does not capture.
Forecast models trained on history and fed by real-time signals, anomaly detection on the flows, and generative analytics to steer attendance live.

Fraud caught in real time, KYC cut by more than half
+40% fraud detection · −60% KYC time
Detect fraud on massive volumes in real time, shorten a KYC slowed by scattered customer data, and make regulatory data reliable, under heavy compliance and sovereignty constraints.
A governed data foundation with MDM for a single customer reference and continuously measured quality, detection models wired into the flows, and a data copilot whose every answer carries its sources.
Insights & Perspectives

MLOps: from experimentation to production at scale
According to Gartner, 85% of ML projects never reach production. What is missing is not talent or algorithms, it is the chain around them.

Data analytics: types and benefits
Descriptive, diagnostic, predictive, prescriptive: what each family of analysis brings, and which question it actually answers.

Beyond the algorithm: six hidden obstacles to AI success
Most AI programmes fail not on the model but on the obstacles underneath it, that nobody measures until it is late.
The rest of the data journey


Anticipate instead of recording
A first model in a real environment, detection wired into your flows and drift kept under watch.
Frequently asked questions
Statistical forecasting projects an observed seasonality. An AI forecast also learns from real-time signals and external variables, which lets it react to a break rather than record it afterwards.
It depends on the seasonality to capture: two full cycles is a reasonable minimum. Below that, the model learns the noise rather than the pattern, and the baseline means nothing.
By calibrating an expected band on the flow's own history rather than a fixed threshold, and by connecting each alert to an action. A check that only logs ends up ignored.
Drift is measured against the reference dataset. Crossing the threshold triggers retraining inside the chain, not a ticket somebody has to prioritise.
Yes. A model trained on ungoverned data learns the defects of the foundation. That is why forecasting comes after governance and quality in our journey.
A person, and that is decided before go-live. A forecast departing from the field is not necessarily wrong: it may be seeing a signal the field has not registered yet. So we write down in advance which gap triggers a review, who arbitrates it and within what time. Without that rule, disagreement is settled case by case, and the model loses its credibility at the first arbitration made against it without explanation, which happens faster than a forecasting error.
Within written bounds, and never on an amount that commits on its own. Replenishing a routine item, within a defined quantity range and under a ceiling, runs without intervention and saves real time. Above that ceiling, or on a critical item, the forecast proposes and a person approves. The boundary does not come from distrust of the model: it comes from the fact that a wrong order is paid in cash, and that responsibility has to carry a name.